Ninety days to put evidence in the 2020 plan, and leave the team able to keep gathering it.
Everyone stated the problem and left.
Arrow Electronics distributes electronic components and enterprise computing solutions. In 2019 it ranked 109th on the Fortune 500, the largest public company headquartered in Colorado. Its enterprise computing business sells IT through value-added resellers, and the IT group that serves those partners had a problem it could describe but not yet define. Tools had grown one pocket at a time. There was no single place for a partner to go, and a reseller got a different experience depending on which door it came through.
The group was trying to prioritize investments in automation and forecast its 2020 development costs. It wanted a self-service portal for partners, and past custom builds had shipped and found no users. In the team's own words, the worst outcome was to get overconfident about the value statement and boil the ocean
. So they asked ClientSolv for a customer experience consultant, and I arrived on 12 November 2019 with ninety days.
The team had no brief. The people who wanted a portal had each said what the problem was and gone back to their own work, and the team wrote that down on the first canvas we filled in: Everyone said the problem statement and left. It's up to us to define the user needs.
That is where research has to start, and the team had a 2020 plan to write. The first week went to the eight people on the project team: one-to-one interviews, recorded, run the way we would later run them with customers, so that everyone who would ask a customer a question had been asked one first.
A plan the team could see
Three artifacts came out of that week. An Innovators' Compass put the team's principles, observations, ideas, and experiments on one page, with the people it was for in the middle. A provisional stakeholder map drew who at Arrow talked to whom on the reseller side and the supplier side, the first picture anyone had of where the experience could break. And an experiment backlog in Airtable cut the ninety days into two-week sprints with due dates, so the research ran on the cadence of the software team it was for.
| Experiment | Status | Sprint | Due |
|---|---|---|---|
| Project stakeholder interviews | Complete | Sprint 0 | 22 Nov 2019 |
| Internal user interviews | In progress | Sprint 1 | 6 Dec 2019 |
| Provisional personas and blueprint | In progress | Sprint 1 | 6 Dec 2019 |
| Collect existing research | In progress | Sprint 1 | 6 Dec 2019 |
| Reseller interviews | Ready | Sprint 2 | 20 Dec 2019 |
| Supplier interviews | Ready | Sprint 2 | 20 Dec 2019 |
| Gather service metrics | Grooming | Sprint 2 | 20 Dec 2019 |
| User story mapping | Grooming | Sprint 3 | 3 Jan 2020 |
| Prioritize opportunities | Grooming | Sprint 3 | 3 Jan 2020 |
Employees first, to earn the customers.
Customers were the point, and the team did not yet have the standing to ask for them. Account executives owned those relationships. A consultant's request to interview a reseller's executive gets declined by default. So sprint 1 went to the people inside Arrow who already talked to partners every day. That meant seventeen interviews across executives, sales, IT, finance, operations, marketing, and engineering.
The account executives got the fullest version. We recorded each conversation, and with each one drew the partner's year on the wall in sticky notes: what happened before a sale and after it, what came around weekly and quarterly, and where the phone calls came from. The maps were rough on purpose. A paper map drawn with the person in an hour says what the person believes. The point was to collect the internal assumptions in a form the customer interviews could confirm or overturn. The provisional personas that came out of the sprint were labeled provisional for the same reason.
The same weeks doubled as training. Team members sat in on interviews, then ran their own with me in the room, then coded what they heard into the repository. By the time we went to customers, the team had watched the questions work on colleagues. That is what earned the next permission: business development, which sat on the project team, agreed to let me interview their customers directly, on Arrow's behalf, and the rest of the project stood on it.
Fourteen customers, unfiltered, one query away.
Fourteen interviews with customers followed, eleven at resellers and three at suppliers, from executives and sales leads to the operations people who keyed the orders. Two of the reseller conversations happened on their premises. Each ran about an hour and was recorded. I ran every one of them, alone or with a team member observing, so the customer was talking to a researcher and not to the account executive who owned the relationship. That is why the material came back unfiltered.
Resellers described purchase orders by the thousand, keyed by hand. Invoices arrived with six decimal places, or for a single penny. Order status came by phone. A credit process slowed deals at the moment they were ready to close. Suppliers described a distributor they could not see into. There was no dashboard for the programs they funded, and no way to show their own leadership what those programs had returned. A few of them said things about how Arrow treated its partners, and the team heard them in the customer's own words.
The repository
Every recording went to transcription. Every transcript was cut into observations: one statement, one speaker, one place in the journey, tagged by role and by topic. They lived in an Airtable base built for the purpose. By the second week of January the base held more than 1,600 of them. A query could pull every observation about invoicing from every operations lead. It could pull everything a supplier had said about market development funds, the money suppliers put up for resellers' campaigns. The team could read the evidence behind a claim instead of taking my word for it.
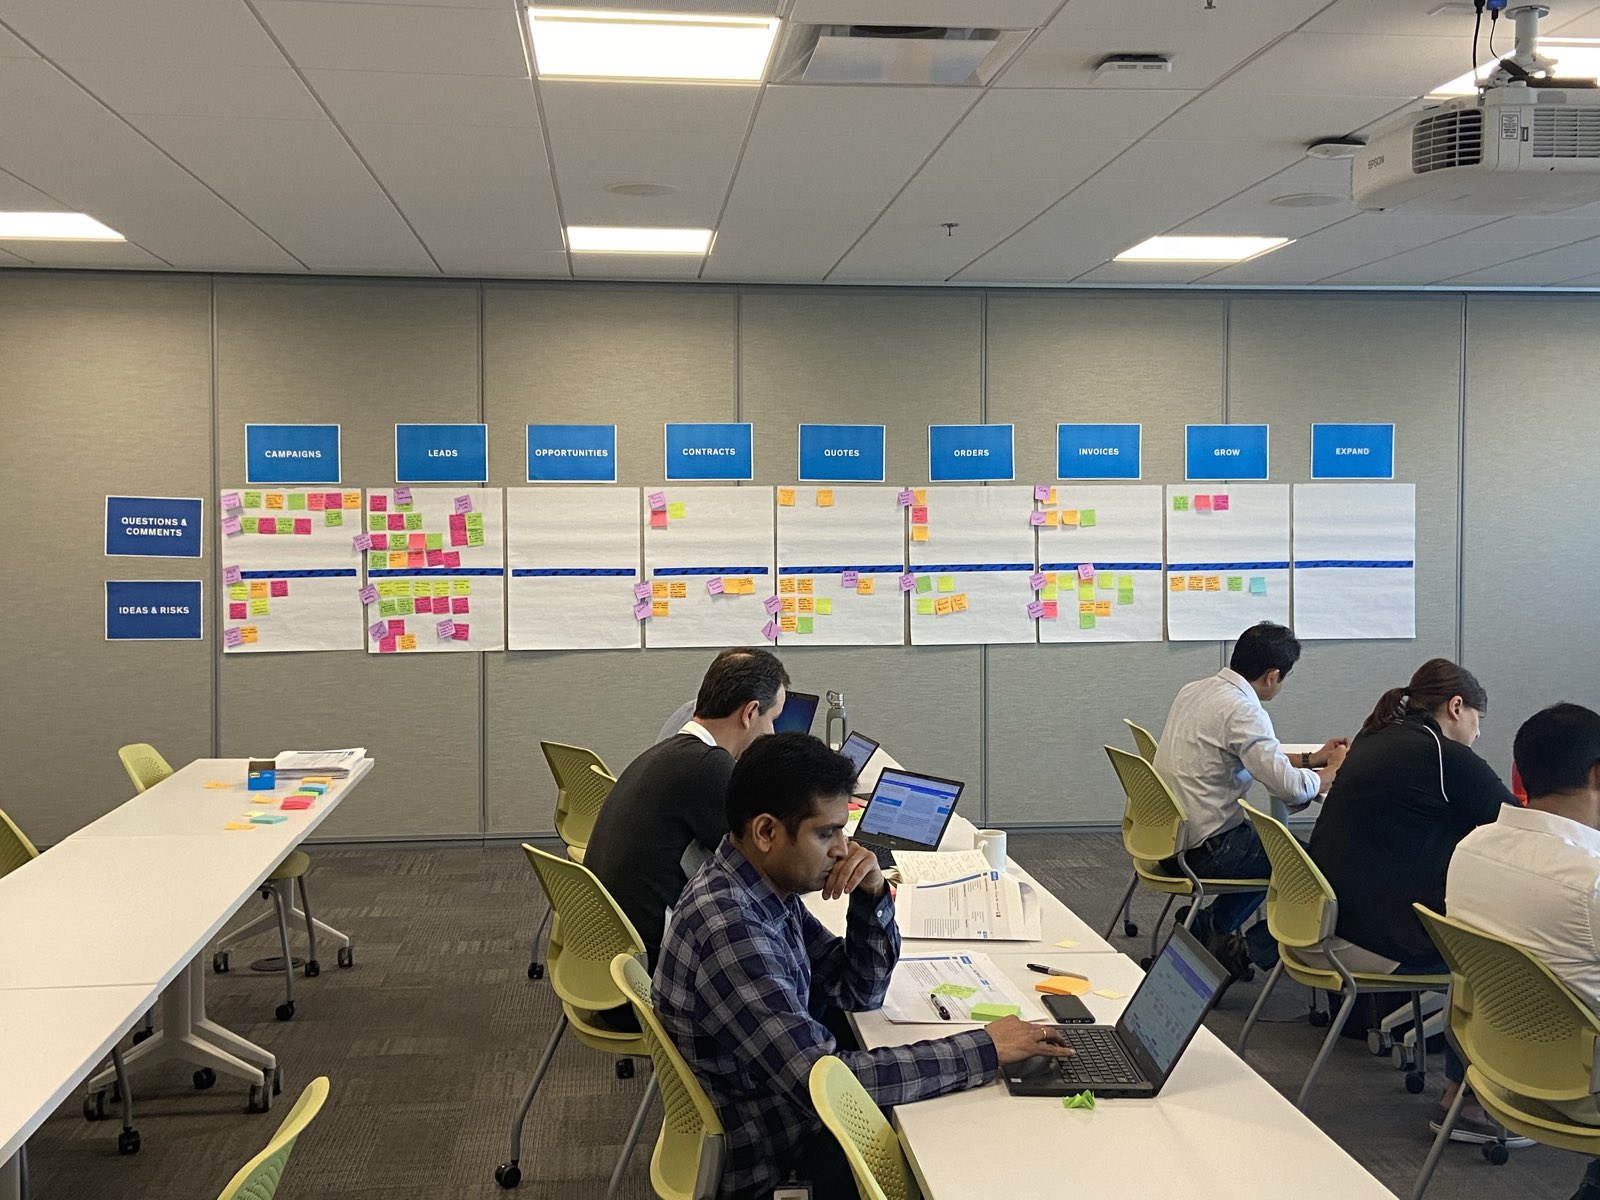
Insights were written on top of the observations. Each insight card carried the observations behind it and its place in the journey, so anyone could get from a claim back to who said what. More than fifty insights went onto a journey map with eight stages, from campaigns to growth. They also went onto five personas: a reseller's executive, sales, operations, and IT, and a supplier's distribution manager.
The distributor's value in a deal is not always visible to us, and the industry is asking what a distributor is for.Journey · growth
Without a dashboard there is no way to track a program we fund, or to show anyone what it returned.Journey · campaigns
Invoices arrive with the amount carried to six decimal places, and some of them are for a penny.Journey · invoices
Eight levers. A ninth: keep researching.
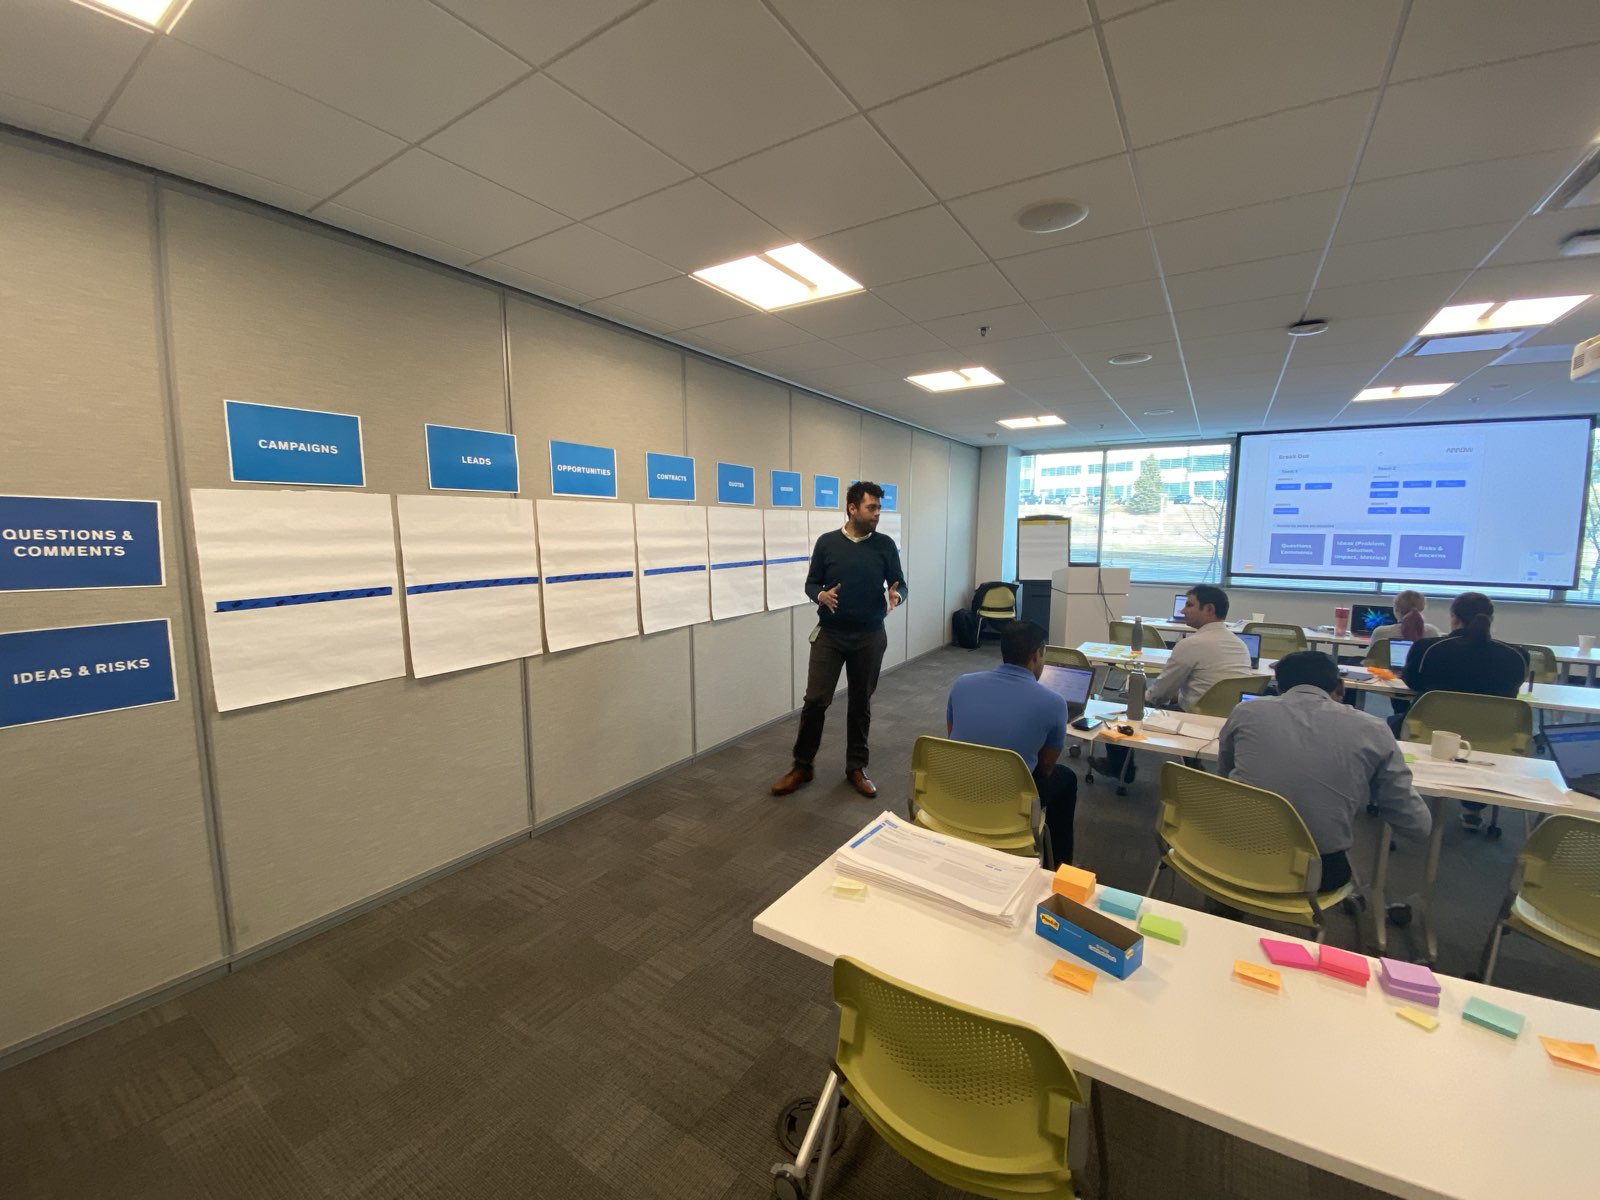
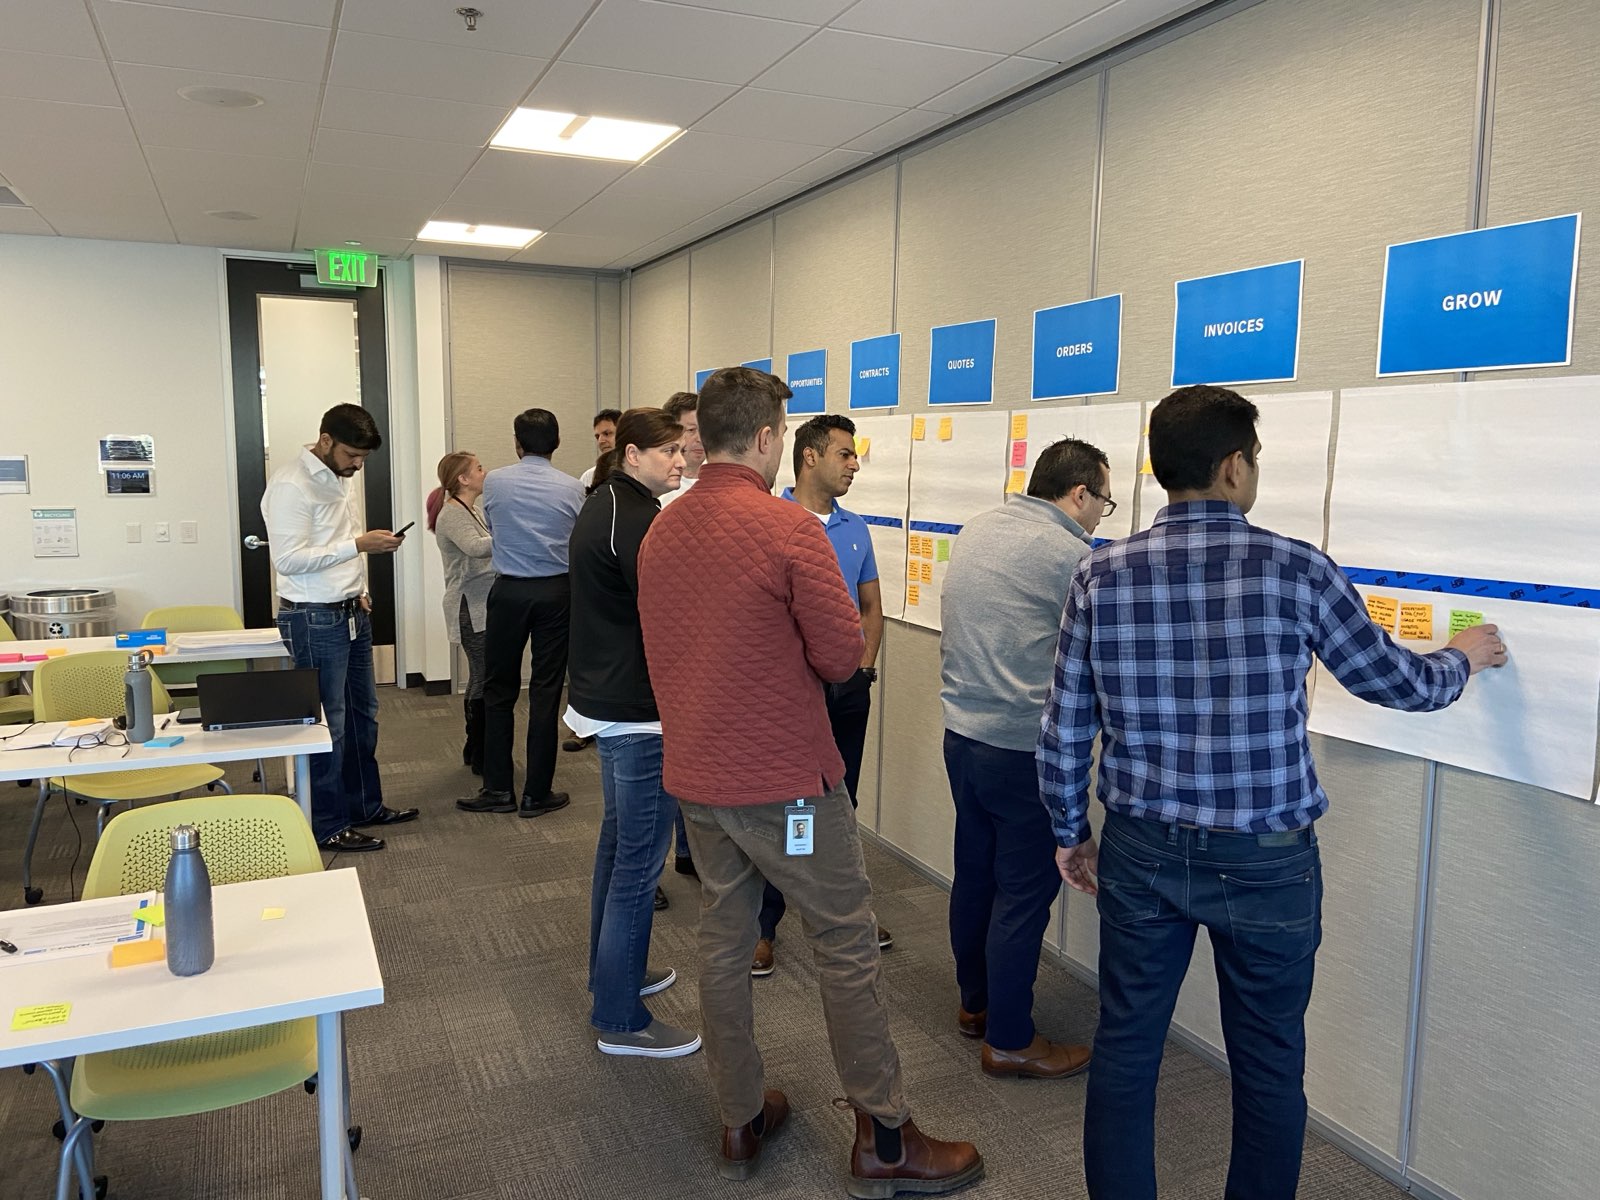
The journey map and the personas were built to be argued with, so we put them on the wall and invited the arguments. Four ideation workshops ran in late January and early February, Arrow's first design-thinking workshops. They brought together people from sales, IT, finance, operations, marketing, and engineering. Each ran the same way: read the journey map, stand at the stage you know best, write what you would change on a sticky, and put it where it belongs.
About four hundred stickies came off the walls. We typed them into the repository as ideas, tagged to the same journey stages as the observations, and sorted them into twenty themes. Some were tools. Some were the same complaint from the inside, and a few of those were about how Arrow treated its own partners, which no tool would fix. The sorting was there to let twenty themes collapse into design opportunities the team could test, and they collapsed into eight.
Written as hypotheses
Each candidate was written as a hypothesis statement: we believe this outcome will be achieved if these people can get this done with this tool. Written that way, an idea carries its own test. The core team scored nine on a matrix of value against risk, where value meant how much it would hurt Arrow not to act, and risk meant how much could go wrong in building it. Seven came through as tools. With the self-serve platform they would all sit on, never scored because it was the ground for the rest, that made eight design opportunities, the eight levers. By my reading of their impact lines, three grow revenue and five cut cost. To price them against the rest of the 2020 backlog we used cost of delay divided by duration, so that a research experiment and a feature could be ranked on the same axis at sprint planning.
The ninth hypothesis was not a tool at all. It was the team's own capability to keep doing this research, and they scored it as the highest-value, lowest-risk thing on the board. That score is what the last act is about.
revenue, my readingcostthe capability itselfthe eighth lever, the self-serve platform, was not scored; I read it as cost
The portal was half the answer.
The finding underneath all eight levers was that a portal could carry only part of the partner experience. The rest lived in Arrow's own workflows and policies, and the team wrote that down for leadership instead of boiling the ocean.
Day ninety fell on 10 February, and the team wanted something executives could react to in one-on-ones. So the opportunities became speculative designs: one partner portal, drawn as if it already existed, with each lever as a panel of a single dashboard. Orders tracked from quote to invoice. Credit released without a phone call. A quote builder with live pricing. Products suggested for an open quote. Campaign funds and what they returned. Vendor certifications flagged before they lapsed. Introductions to other resellers.
They were props for a conversation, and each executive was told so. The executive summary written for day ninety ended on a question, and the props were there to ask it. What evidence would the business need to be sure a problem we had found was worth solving with a self-serve tool? And which problems would be better solved by changing a workflow or a policy?
The answers became the design team's next steps. Some opportunities would go back to a panel of partner users for testing. Some would go nowhere until finance changed how it worked.
People, process, tools
The last weeks went to making sure the research would keep running after I left. The team and I wrote its UX process as one diagram: four ceremonies from the sprint cadence it already ran, eight activities across them, and for each one an owner, the artifact it produces, and the tool it runs in. Questions and ideas come in on a canvas, get prioritized as hypotheses, and become a validation plan. Sprint planning prices the experiments. The sprint builds them, measures them with real users, and codes what it learns into the repository. The retro is where the insights get shared. The people row matters most. A process with no owner does not get run.
On 5 March I handed over the presentation for the wider team, the repository, the diagrams, and the process, and the engagement ended.
What stayed after the ninety days.
- The 2020 plan had evidence in it. The enterprise computing IT group used the insights to prioritize its work and to forecast software development costs for the year, which is what it had hired the pilot for.
- The team kept the method. What stayed at Arrow after the invoice was the repository, the process with an owner for every step, and the people who had run interviews and coded observations. The capability was the deliverable; the eight levers were what it produced first.
- The UX team got heard. The digital strategy director said the research validated what the designers had wanted to do all along and gave them a plan to take to the head of the enterprise computing business.
- The repository became a course. In August 2020 I taught the practice behind it publicly as FAIR UXR, a free eight-lesson course built with Alicia Holdsworth, an instructional designer. It teaches Tomer Sharon's atomic research kept to the FAIR data principles: findable, accessible, interoperable, and reusable.
“He is very engaging, approachable, and we trusted him to interview our customers on our behalf to get a true unbiased voice-of-the-customer.”
“Having you come in allowed our UX team to break free. You validated what they wanted to do but no one was hearing them. So now if we were to go to the head of ECS we could actually showcase a plan that covers absolutely everything.”
“Very skilled at taking an evidence-based approach (UX Atomic Research) to problem solving… Miguel came in day 1 and with him he brought a wealth of knowledge and expertise to the team.”
Colophon · Partner companies and the people interviewed are not named, quotes are attributed by role, and interview material is paraphrased. Artifacts are redrawn and the portal is a reconstruction with synthetic data, not a screenshot; the photographs are from the workshops. The clustering in the header uses real counts and simulated positions.